
Dashboard
Dashboard:
This is to get an insight into the clinic at a glance. It visualizes key metrics to monitor clinic performance.
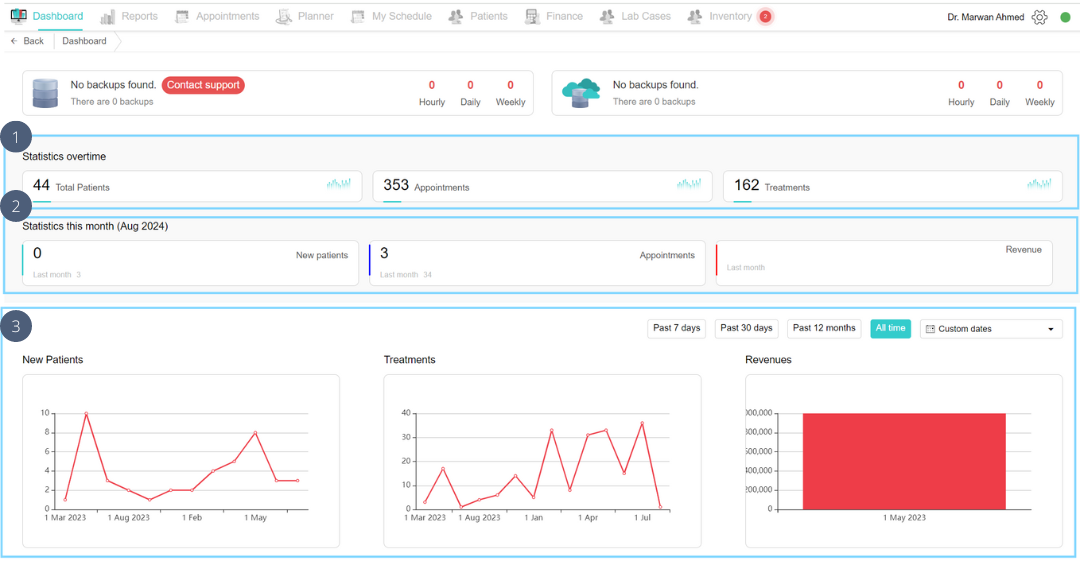
1. Statistics overtime
It shows the total number of patients, total number of appointments and total number of treatments that have been added since using the system.
2. Statistics this month
This shows the total number of patients, total number of appointments and this month’s revenue for the current month. Beneath the number are last month’s numbers, this can help compare between the months to monitor the changes.
3. Statistics visualization
This shows a graph of the new patients, treatments and revenue for the select time period. It can be filtered by past 7 days, past 30 days, past 12 months, all time, or choose from the calendar.
No Comments